pages

Showing posts with label ESXi. Show all posts

Monday, March 28, 2011

vCO - set Jumbo Frames (MTU) for VMkernel

Last week I spoke to some fellows here at VMware and think about a solution to automate the MTU size for a dvPort/PortGroup with vCO automation. In the past there was no automated way than the excellent solution by Scott Lowe. Based on these findings i try to build this in vCO, knowing that the vSphere Client does not support this directly.

At first i had to identify the Port which serves the vmkernel and a few input parameters:


At first I need the host (in my case as string because this is used for an external excitation via SOAP), the name of the dvSwitch, the new IP address of the vmkernel interface and the new subnet mask. So i set the host (VcPlugin.getAllHostSystems) and use the getAllDvSwitches workflow from one of my last publications.


After that I set the dvSwitch based on the input parameter (dvSwitch) and searching for the right port. The main procedure to identify the right port is: if(Ports[h].connectee.type == "hostVmkVnic") cause this compares to the vmkernel NIC.


At this point I know everything to change the MTU of the vmkernel Port, but... the API shows an cruel description:


So as mentioned when reading the article there is no direct API based way to set the MTU of a dvPort. In my case I solve the problem with using direct ssh commands. The drawback with this is the username/password dependence.


So after identifying the right host, the vmkernel port, the new ip address and subnet mask the ssh commands can run. As you can see I used exact the same commands as the console guys use.

So, hope this helps.

Monday, November 15, 2010

ESXi - esxtop/resxtop and perfmon

Last week I had an appointment with one of our customer who wants to know more about esxtop/resxtop. So I decide to write some, in my eyes, important things to know. Because of the simple display esxtop wasn´t the tool for me to troubleshoot in the past. But with the enhancements in vSphere 4.1 there are some useful possibilities.

With this article iI want to show how to use esxtop in batch mode and how to evaluate the collected data in perfmon.

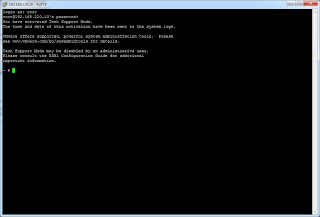
First we start with the ssh connection through the host (don´t forget to enable it on the security settings in the host configuration screen).


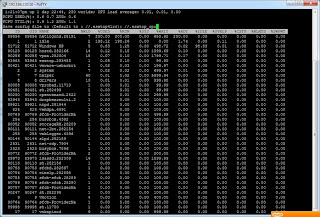
After that we start esxtop and create an new configuration file which only collects cpu metrics. You can do this easily by pressing "W" and name the new configuration file //.esxtop_cpu in my case.


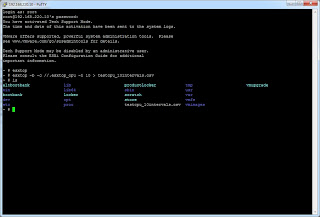
After the configuration file is written you can close the esxtop screen by pressing "q". Now you can start the data collector with a simple command:

esxtop -b -c //.esxtop_cpu -n 10 > testcpu_10intervals.csv

The "-b" switch is for the batch mode, the "-c" switch is for the configuration file, the "-n" switch is for the intervals (be careful with more because of the disk usage) and the > pipes the data into the .csv file.


After the execution is finished there should be a .csv file with the collected data. This file we copy to a windows workstation and open the perfmon (in my case a Windows 7). Inside the performance monitor there is a button called "View Log Data" which allows you to import the .csv file.


After adding the .csv file you have to add the data (data tab)...


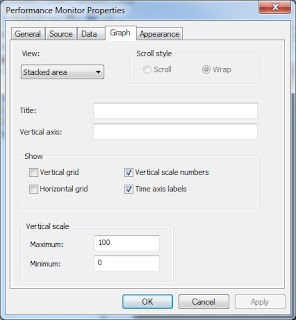
and the display options (Graph tab) in the performance monitor.


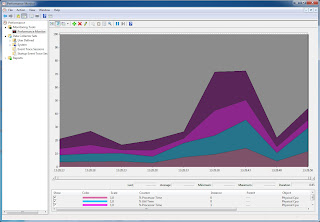
After the performance metrics (in my case: physical cpu (0,1)) are choosen the graph will be showed in the performance monitor. Now you are able to look the ESXi performance data in a historical graph.